Seventy-eight pending comments?!? SEVENTY-EIGHT?!?!?
Something has to be done. I don’t know what I’ll do, but whatever I do, it will be done. My current idea is something like the Google 2-factor authentication. In order to post a comment, you’ll have to enter the correct code generated from somewhere.
Today I’m going to go a little bit in depth about my analysis of a recent CS assignment which had to do with Keirsey’s Personality test. Before that, though, I’m going to give out two links:
- http://pillow.rscheme.org/utclass/ - This is my first version of a program to figure out UT class schedules. It’s very much not pretty, but I don’t have enough time this week to fix it before registration (also this week) so I’m going to throw this out there.
- https://webtail.me/www/ - It’s linux’s tail (or cat), but over the internet!
(UPDATE 2017: Yes, those are both dead links)
And now, for the feature presentation.
Introduction
My most recent CS assignment had to do with processing data collected from Keirsey’s test. Keirsey’s test, as a reminder, is a 70 question test which attempts to classify personalities in four main “groups,” or “axes” as I will be referring to them. These 70 questions are put in four groups which correspond to the above axes. Each question can be either “A”, “B”, or unanswered, “-”.
To determine the personality of a person, each axis is viewed independently of the others. A percentage count is made of the number of “B” answers out of all answered questions in that group (unanswered questions are discarded), and the percentage determines which category the axis falls under. Here is a table of the four
| <50% | >50% | |
| Extrovert vs. Introvert | E | I |
| Sensation vs. iNtuition | S | N |
| Thinking vs. Feeling | T | F |
| Judging vs. Perceiving | J | P |
This writeup explains the progress I have made in attempting to predict, using Principal Component Analysis (PCA), grouping (primarily using DBSCAN), and finally an analysis of a covariance matrix that was generated from the provided data.
Raw Data
The data consists of 500 test responses from Vallath Nandakumar, who originally sourced the data from the University of Washington who ostensibly quizzed their students. The data consists of pairs of rows, alternating the name of the participant and their answers to the questions. For example (names have been altered):
John Smith
bABBAABBBBBAAABAAAAaBBaBAABABaBBABABABAABABAb--ABBABAAAABBaBABABBAA-BB
Note that there are three unanswered questions from John Smith. I and a partner wrote a Java program to analyze this data to provide the percentages of the different axes. Because this Java program was part of the CS class assignment, I cannot post the source code. However, here is the output given the above data:
100 50 23 45 = IXTJ
The four numbers correspond to the above four axes, respectively. What this says is that John Smith answered 100% “B” to the I/E group of questions, 50⁄50 to the S/N group of questions, 23% “B” on the T/F group, and finally 45% “B” on the J/P group. According to the table above, this leads to John Smith having the personality “IXTJ.” Note that in cases where the question group is split 50⁄50 between “A” and “B”, the personality letter is “X”.
So there are two ways that I used to represent this data. The first that I use is representing the above four numbers as four coordinates in a four-dimensional vector. The above data would give us the vector <100,50,23,45>.
The data was split into two sections, training and testing. The training data consisted of the first 300 datapoints, and the testing data consisted of the remaining 200.
Programming Languages and Libraries Used
With the exception of the above Java program, all of the processing was done in Python using Scikit and NumPy.
Processing and Predicting the 4-Dimensional Vector Space
The first experiment I tried was to perform grouping on the four dimensional vectors, and try to predict any one axis from the other three by finding the nearest group. DBSCAN was set to eps=13 and min_samples=3, and found 12 groups.
Here’s a graphic to demonstrate how the predictor works in two-space. You can imagine it extrapolated to four-space:

The output value is set to the green dot within the ellipse with the shortest (signed) line to the known axis (in blue).
The accuracy of this method is as below:
Mean: 0.0 stddev: 37.50245275
Correct: 33 Incorrect: 20 (62.26%)
Mean: 0.0 stddev: 28.1709739552
Correct: 33 Incorrect: 20 (62.26%)
Mean: 0.0 stddev: 24.0204315547
Correct: 32 Incorrect: 21 (60.38%)
Mean: 0.0 stddev: 25.4576970605
Correct: 36 Incorrect: 17 (67.92%)
Each row of the four represents the accuracy of the predictor at predicting that one axis given only data about the other three. This 60% accuracy is better than 50% accuracy, although still not too great. Much of this inaccuracy comes from the fact that for any given set of three axes, there are people with both personality types along the unknown axis, and it is impossible to always predict that.
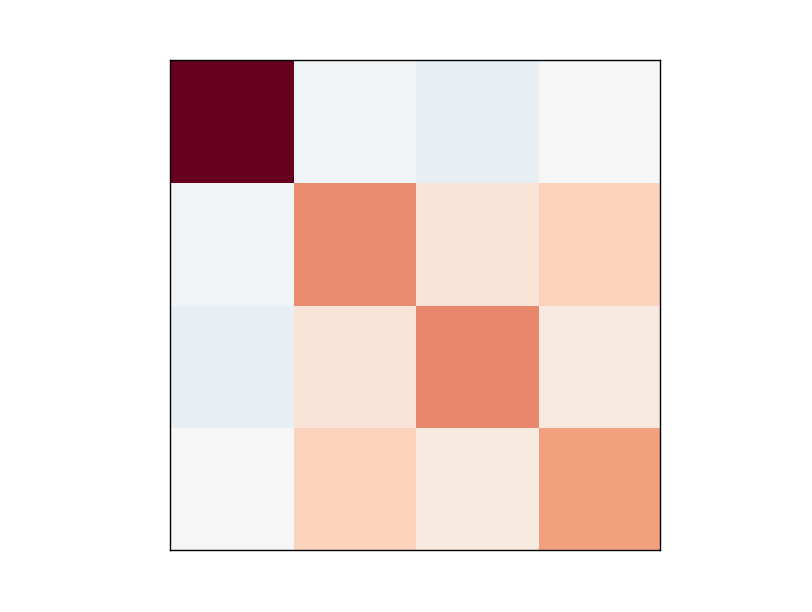
However, there are correlations between the four personalities. I prepared a covariance matrix for the four axes:

Going from left to right, and top to bottom, are the four dimensions E/I, S/N, T/F, and J/P. Orange/red means a positive correlation, and blue indicates a negative correlation - the darker the color the stronger the positive or negative correlation. Note that by design this image is symmetric across the diagonal going from upper-left to lower-right.
The interesting thing to note is that most of the axes have some relation to the others except for the E/I axis. This means that if you have a high score in, say, S/N (i.e. a high iNtuition), then you’re typically going to tend to have a slightly higher score in T/F and J/P. However, you don’t know per se where you sit on the E/I axis. More on this later, until then let’s have a look at the 70-dimension vector space.
Processing and Predicting the 70-Dimensional Vector Space
For the 70-dimensional vector space problem, I decided that grouping would not be the best way to go but rather to experiment with Scikit’s KNearestNeighbor API. The K-nearest algorithm is relatively straight forward - given some inputs, it finds the nearest input that it “remembers” and assumes that it’s the same output.
In this case, the input is the 50 (or 60) dimensional vector that corresponds to the personality axes that we know. There are 20 questions for each group, except for the E/I group which has 10. I built four different sets of data, each with a different group removed (respectively). Then I ran each dataset through the KNearestNeighbors algorithm to try to predict each axis given the other three. Here are the results for each axis:
Predicting from KNeighbors
0.610837438424
correct: 124 incorrect: 79 (61.08%)
Predicting from KNeighbors
0.620689655172
correct: 126 incorrect: 77 (62.07%)
Predicting from KNeighbors
0.610837438424
correct: 124 incorrect: 79 (61.08%)
Predicting from KNeighbors
0.743842364532
correct: 151 incorrect: 52 (74.38%)
The interesting thing of note here is that the accuracy is roughly the same as with the above 4-dimensional grouping, and a little bit more accurate for the last one (J/P).
This indicates that there is very little cross-correlation between individual questions and personality groups that it doesn’t belong to. For instance, any given question in the T/F group has relatively little correlation to the S/N group. This is similar, though not the same, as what we saw above with the 4-dimensional vector space, where we saw that the T/F group as a whole has relatively little correlation with the S/N group. The 70-dimensional analysis shows that no individual question has an undue correlation to other groups.
The exception to this is the last group, J/P, which has a 75% prediction rate, well above the 67% prediction rate for the 4-dimensional grouping algorithm. The higher prediction rate here shows that there are other questions that do, in fact, tend to bleed over into the J/P group.
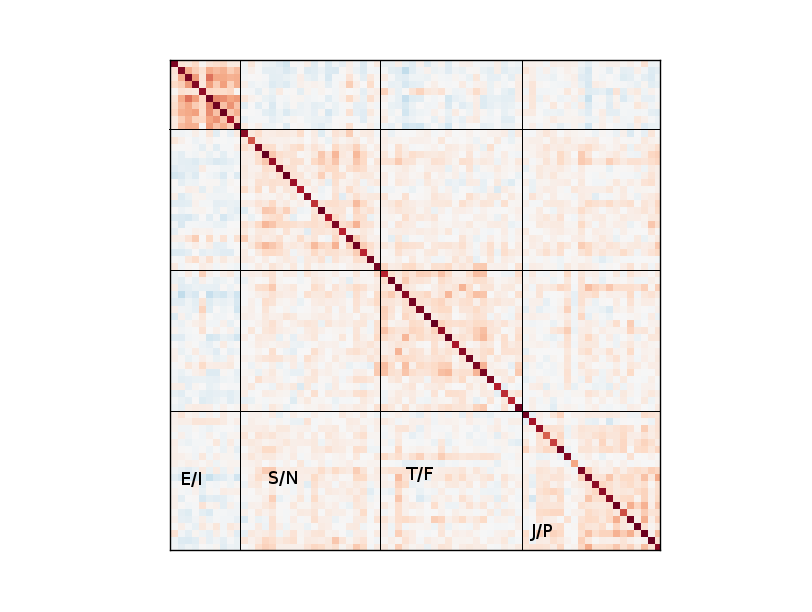
Below is a covariance matrix that I created showing the individual questions correlated with each other:

The lines and labels were added later. The color scheme is the same as above.
This matrix shows much more clearly the intense relationships within the E/I group. We saw this in the 4-dimension matrix, where the E/I group was not very correlated with other groups. However, this matrix shows that for any given question in that group, it is highly likely that the participant guessed other E/I questions with the same bias. That is, introverts and extroverts tend to be more strongly introverted or extroverted than the other groups - the J/P group will have a lot of people who have a little bit of both in them.
Thus concludes my analysis of the Keirsey Personality data. In the end I have found that yes, certain Keirsey personality traits can be predicted to some degree, although it is difficult to exceed performance beyond utilizing a simple statistical breakdown. I leave attempts in that field to people who know what they’re doing (including my future self).
