This week I started work on a system to record the usage of the assorted labs at UT’s CS department. It’s a similar system as what they have at http://utcslabs.org/ (UPDATE 2017: Broken link), except that mine actually works and will remember data going into the past.
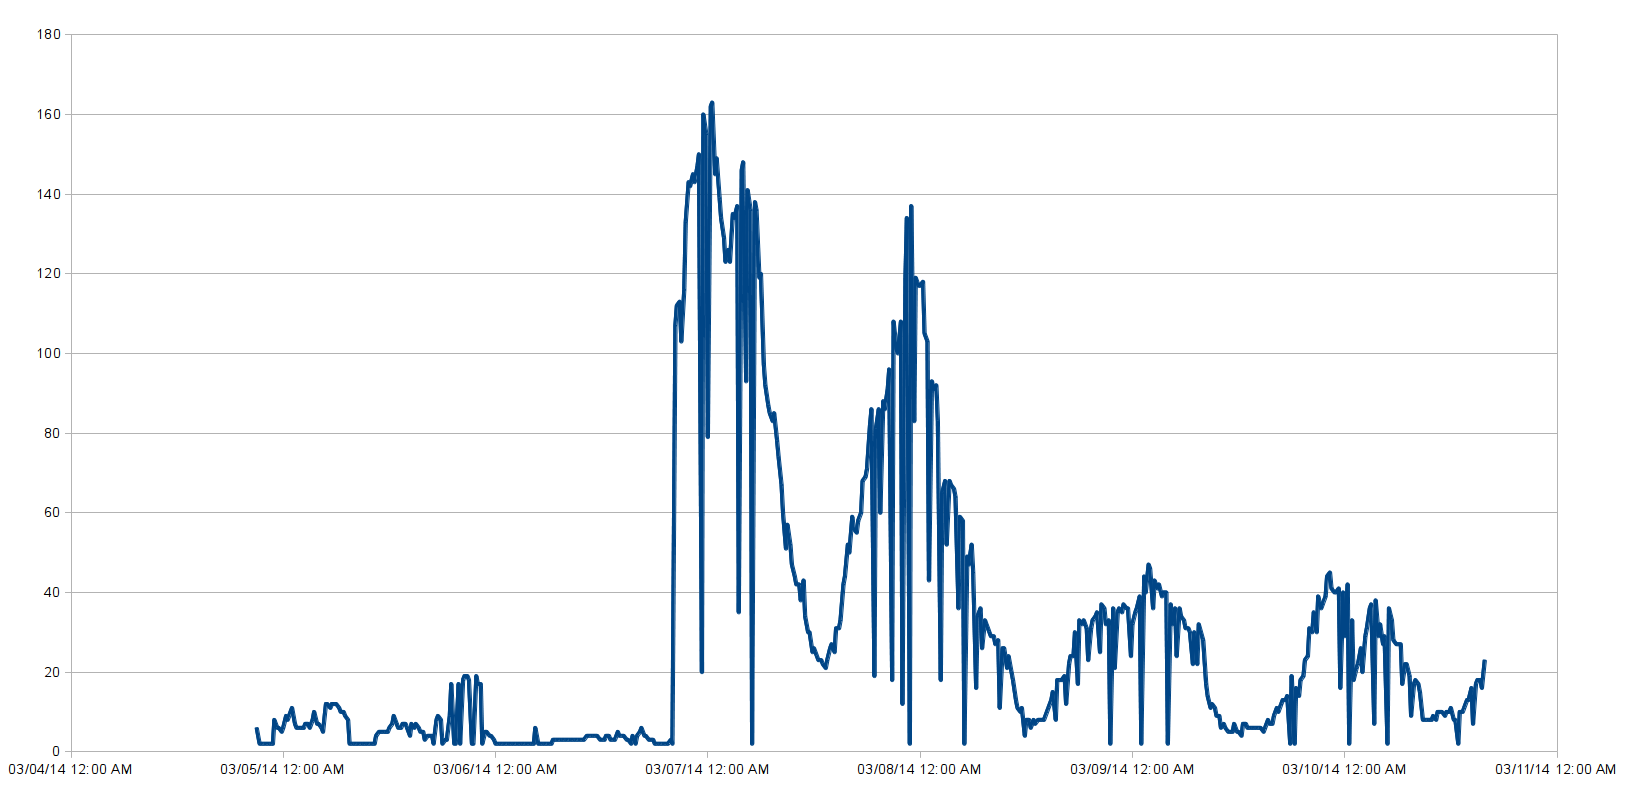
As a preview snapshot, here’s a graph of the number of total logins at UTCS versus time:

It has a little bit of noise in it, but the interesting thing to note is that the peak login time is ostensibly around midnight at 160 concurrent logins, dropping to between 5 and 20 logins just before noon. Note that 3⁄8 and 3⁄9 were the weekend before Spring Break, so they have an unusually low count.
Before 8:00 in the evening on 3⁄6 I only have data from a testing script I was running on one machine, which is why the logins remain under 20.
Anyway, that’s just the tip of the iceberg, so to speak. I have the rest of the iceberg lying around - I’ll bring it out to show you guys sometime.
