Happy Easter! Good hunting to all of you egg-hunters. My family raises chickens, so we get all the eggs we want.
One of the (many) things I like about Ubuntu is that when I’m doing a major OS upgrade, it runs in the background so I can blog and catch up on XKCD.
As promised, here’s some links to Pong and 2048 for LEAP: http://pillow.rscheme.org/pong/
http://pillow.rscheme.org/2048/
The 2048 version doesn’t require a LEAP device to play. The pong game does.
I was going to show off some cool graphs showing a vast number of users on my proxy, but the “vast number” was actually a temporary spike. I’m now back to pre-March levels at 50,000 hits/day (which is roughly 5,000 impressions/day or 150,000 impressions/month).
Quick background: I run an internet Glype proxy. If you Google “glype proxy” I’m the fourth hit. These users come from literally all around the globe, and visit exactly two areas of the web: Facebook and… adult websites. The graph below shows number of hits/day on a rolling 7-day average since the beginning of the year (so from January 1st 2014 to mid-April 2014). As you can see there was a major spike a few weeks ago to nearly 200,000 hits/day - equivalent to around 1 million impressions/month.
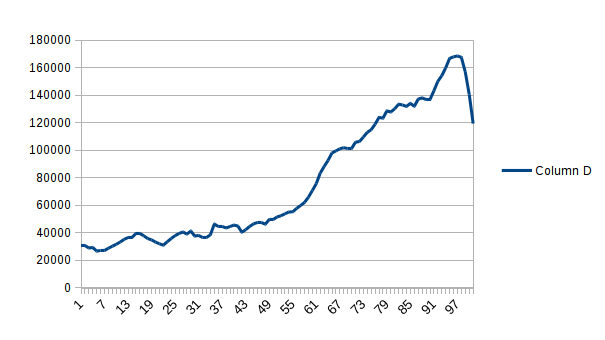
With so many users, I decided to monetize it. If you want to buy ads on my website, please do so! http://buysellads.com/buy/detail/236307 Sure, there aren’t as many users now as there were, but an impression is an impression is an impression, and I’m still making lots of those.
But, more to the point. In the mid-afternoon of Monday the 14th, I opened a remote desktop connection from UT to my house to get some work done (my job now includes a Windows VM with MS Visual Studio. Oh boy). That day corresponds to the end of the spike. But that got me to thinking: How could such a small action correspond to such a large reaction? Is my base of users really that small? Was the disruption really that big?
During this spike I wrote some scripts to parse my proxy logs and dump it into a Mongo database, so that I get documents that look a little like this:
{ "status" : 200, "domain" : "www.ign.com", "server_time" : 2629821, "hour" : 7, "ip" : "xx.xx.xx.xx", "bytes" : 30570, "month" : "Apr", "method" : "GET", "second" : 0, "year" : 2014, "path" : "/boards/threads/how-to-increase-s-p-e-c-i-a-l-in-new-vegas.197299482/", "day" : 9, "minute" : 51 }
{"status" : 200, "domain" : "a.thumbs.redditmedia.com", "server_time" : 1822975, "hour" : 7, "ip" : "xx.xx.xx.xx", "bytes" : 1634, "month" : "Apr", "method" : "GET", "second" : 1, "year" : 2014, "path" : "/wXmTL_Eeu7z1iFUf.jpg", "day" : 9, "minute" : 51 }
{ "status" : 200, "domain" : "s.ytimg.com", "server_time" : 3681763, "hour" : 7, "ip" : "xx.xx.xx.xx", "bytes" : 9361, "month" : "Apr", "method" : "GET", "second" : 59, "year" : 2014, "path" : "/yts/cssbin/www-pageframe-vflycrJAA.css", "day" : 9, "minute" : 50 }
The IP addresses have been changed to protect the innocent.
Point being, I get the request, the time, and the amount of time the server spent serving the request (server_time) - i.e. microseconds between when the request came in and when I finished writing the response. I don’t have data on how long the remote server took to respond. The obvious thing to do was to start graphing things. Above was the hits/day, now here’s a graph of the average latency per hour - that is, in a given hour, the average latency of all the requests within that hour:
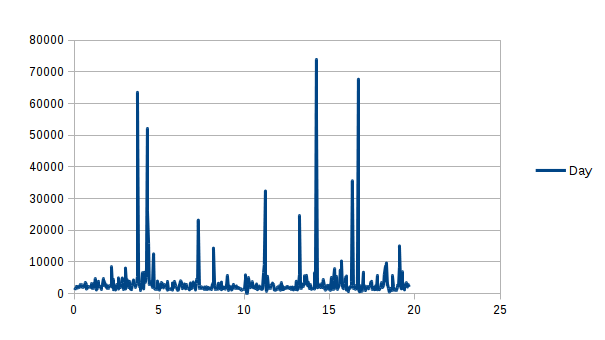
Yup, sure enough. A spike up to 70 seconds/request about six days ago (graph goes from April 1st to April 20th, X axis is in days) - enough to make any man decide to do actual work instead of watch porn. Which while that may be good for those businesses out there, it’s bad for business here. There is no win-win scenario here.
But, sure, there was a bad spot there. And it was during my busiest time. Such a short spike, and such a large reaction, can really only mean that a large portion of users were affected during this spike. So, back to the spreadsheets! Here’s a graph of the number of unique IP addresses using the proxy on a given day:
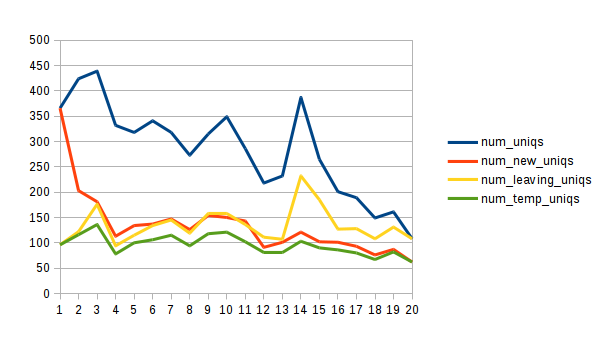
But this doesn’t really tell the entire story, since it could be the same IP addresses hitting my proxy every day, or it could be a whole new set of IP addresses that happen across my proxy every day. So here’s a graph showing the data above, as well as the number of IP addresses that were “gained” and the number that were “lost.” “gained” means that we had never seen this IP address before that day, and “lost” means that we have not seen that IP address between that day and today.
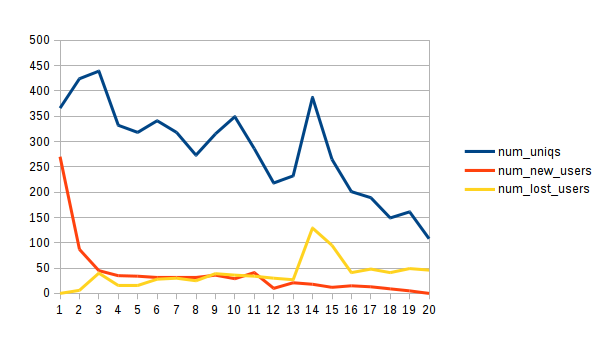
These two graphs are also collected from April’s data, which is only 20 days long as of today. So not much data, but enough to make some observations on.
The first observation to make is that early on in the month (between the 4th and the 12th, roughly speaking) we see around 300 users per day. Of them about 40 are new users which we’ve never seen before, and 40 are users we haven’t seen since. Then on the 12th we stop seeing new users - the number dips to around 15-20, and two days later on the 14th we see a massive spike of users that disappear (the yellow line). Notice however that this massive spike corresponds with a similar spike in the total number of users (the blue line). Perhaps my server is unable to handle large numbers of users? Back to the spreadsheets!
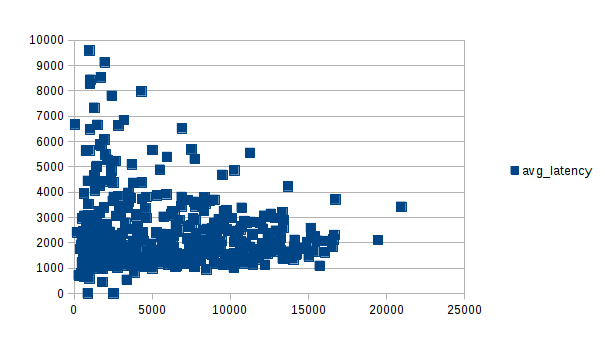
…or on second thought, maybe they’re uncorrelated and latency doesn’t go up with an increase in load. This graph shows the number of hits in a given hour on the X axis and the base-10 logarithm of the average latency in milliseconds on the Y axis. (there are a few datapoints which go above 10000ms, but I cut them off the graph for clarity) Not much correlation in this graph - it looks like an amorphous blob. Maybe a slight upward slope, going from 1,000ms latency at no load to 2,000ms latency at 18,000 hits/hour. Which is nothing to sneeze at, mind you.
But in the end, what do we know? Remarkably little, it turns out. I’ve made a bunch of graphs. They all tell me that on Monday the 14th the world decided that my proxy just wasn’t good enough for them. They hint at possibly the problem being that my latency spiked for a few hours that fateful Monday, but that doesn’t quite explain the continued drop. Maybe I used to be on some website that linked to my proxy. Maybe my proxy stopped working with popular websites. Whatever it is, I feel that the true reason will be lost forever in logs not kept and data not recorded.
This summer, though, I’m going to make a much better proxy. Better than all the others.
Trust me.
